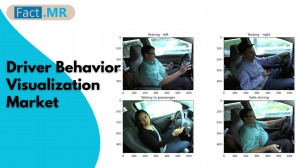
Driver Behavior Visualization Market to Reach USD 8,955 Million by 2035 | Fact.MR Report
The Predictive & Risk Visualization Segment Is Projected To Grow At A CAGR Of 13.5%, Whereas Another Segment Real-Time Dashboards Is Likely To Grow At 12.7%.
ROCKVILLE, MD, UNITED STATES, August 18, 2025 /EINPresswire.com/ -- According to Fact.MR, a market research and competitive intelligence provider, the driver behavior visualization market was valued at USD 2,735.4 million in 2024 and is expected to grow at a CAGR of 11.3% during the forecast period of 2025 to 2035.The driver behavior visualization market is also changing since it experiences a motive of end-users pushing towards safety, convenience, and personalization, as well as real-time personalization in the driving experience. Advanced behavior of driver visualization is no longer considered as a feature that can be added to the fleet or luxury vehicles but rather a central design aspect of the next-generation mobility designs. Behavioural tracking via AI-sense powered sensor-rich facilities and other technologies allow the smooth provision of safety warnings, driving performance and contextual driving-related insights to individual drivers.
For More Insights into the Market, Request a Sample of this Report: https://www.factmr.com/connectus/sample?flag=S&rep_id=10868
Other breakthroughs, including cloud-attached visualization platforms, domain-specific software architecture, and adaptive real-time feedback loops, are not just improving driver engagement but also shifting toward goals of sustainable and regulatory readiness vehicle design. As they also require a clutter-free interface and easily to understand visual prompts, OEMs and solution providers are incorporating ergonomic dashboards, non-obstructive warning systems, and human friendly information representations into the vehicle environment.
Key Takeaways from Market Study
• The driver behavior visualization market is projected to grow at 11.3% CAGR and reach USD 8,955 million by 2035
• The market created an absolute $ opportunity of USD 5,885.5 million between 2025 to 2035
• North America is a prominent region that is estimated to hold a market share of 33% in 2035
• Predominating market players are Valeo, Aptiv, Magna International Inc. , Smart Drive Systems, Denso, and others.
• North America is expected to create an absolute $ opportunity of USD 1,887 million
“Growing demand for personalized driver feedback, rising adoption of safety- and wellness-oriented visualization systems, and continuous advancements in AI-powered monitoring and analytics are expected to propel the expansion of the driver behavior visualization market” says a Fact.MR analyst.
Market Development
The movement towards superior driver behavior visualization is gaining momentum with automakers and technology suppliers incorporating artificial intelligence, Internet of Things connectivity, multi-modal sensor use and other technologies to provide very contextual and personalized driver safety information. An increase in consumer demand of proactive safety, convenience, and real-time digital feedback is encouraging OEMs to integrate the following features into the upcoming makers: Adaptive visualization dashboards, voice activated data query, customized driver coaching profiles.
There is also the rise of sustainability and modularity with cloud-based platforms allowing over-the-air updates, improving algorithms, and features added that can be compliant with updated safety regulations without replacing hardware. The use of advanced visualization of driver behavior is becoming a standard offering as electric vehicles and premium segments gain popular support; and is ever more becoming a differentiator in the connected vehicle ecosystem.
For example, in March 2025, Mitsubishi Electric Automotive America Signs Agreement with Seeing Machines to Promote Guardian Generation 3 Driver Monitoring Technology Across the Americas.
Buy Report – Instant Access: https://www.factmr.com/checkout/10868
More Valuable Insights on Offer
Fact.MR, in its new offering, presents an unbiased analysis of the driver behavior visualization market, presenting historical data for 2020 to 2024 and forecast statistics for 2025 to 2035.
The study reveals essential insights on the basis of the Visualization (Real-Time Dashboards, Post-Trip Analysis Tools, Predictive & Risk Visualization, Driver Coaching Interfaces), Technology (Cloud-Based Visualization Platforms, On-Board Embedded Systems, Mobile & Tablet Applications, Mixed Reality / Simulation Tools), Application (Fleet Management, Personal Vehicle Safety, Research & Development, Insurance & Risk Assessment), End-User (Automotive OEMs, Commercial Fleet Operators, Insurance Companies, Research Institutions & Testing Labs, Law Enforcement / Regulatory), across major regions of the world (North America, Latin America, Western Europe, Eastern Europe, East Asia, South Asia & Pacific, and Middle East & Africa).
Check out More Related Studies Published by Fact.MR Research:
Vehicle-to-infrastructure communication market is expected to grow at a positive during forecast period. North America is expected to dominate the market.
Peer-to-peer EV charging market is expanding from an estimated $1.5 Bn in 2024 to a colossal $7.9 Bn by 2034
S. N. Jha
Fact.MR
+1 628-251-1583
email us here
Legal Disclaimer:
EIN Presswire provides this news content "as is" without warranty of any kind. We do not accept any responsibility or liability for the accuracy, content, images, videos, licenses, completeness, legality, or reliability of the information contained in this article. If you have any complaints or copyright issues related to this article, kindly contact the author above.

